Hi,
I originally repeated this issue using my own live streams.
However for ease of anyone to repeat this issue, I have repeated it with the deepstream-app demo. While running the demo with some minor tweaks (details later), the video o/p & performance starts off ok. However, in less than 30 minutes, the CPU (4 cores) will rail at 100% & the video performance of all 8 streams have dramatically decreased.
The following is a graph of how the 1st video stream degrades over time - note that each sample is 5s:
https://i.imgur.com/qSB9Pi1.png
The following are the details for repeating the issue with deep-stream app:
-The latest Deepstream 4.0.1 is being used & the Jetson Nano is jumpered for high power mode with a 4A power supply. A fan is also attached & continuously running.
-The following modifications were done to the demo configuration file, source8_1080p_dec_infer-resnet_tracker_tiled_display_fp16_nano.txt:
- [b]In [sink0],"sync" was changed from 1 to 0 In [tests], "file-loop" was changed from 0 to 1[/b]
With the above settings, the test runs without any issue. The overall CPU usage is approx. 45% (measured with top or jtop).The reported performance FPS in the terminal is approximately the same at the end of an overnight run as it was at the beginning i.e. approx. 30FPS average.
However we made one change to the configuration file before retesting:
In [source0], “drop-frame-interval” which was originally commented out was enabled & set to 3 as shown:
drop-frame-interval=3
The test was restarted & it seemed to start up correctly. The sample mp4 was repeated 8 times in the 8 windows & object detection/tracking seemed to work well. The performance was shown as follows:**PERF: FPS 0 (Avg) FPS 1 (Avg) FPS 2 (Avg) FPS 3 (Avg) FPS 4 (Avg)
FPS 5 (Avg) FPS 6 (Avg) FPS 7 (Avg)
**PERF: 12.70 (12.70) 25.38 (25.38) 11.90 (11.90) 12.45 (12.45) 8.41 (8.41)
26.85 (26.85) 17.34 (17.34) 8.99 (8.99)
**PERF: 15.97 (15.74) 14.91 (15.74) 10.57 (10.67) 12.18 (12.21) 7.38 (7.44)
19.88 (20.53) 14.90 (15.10) 8.03 (8.10)
However after 8 minutes, the CPU cores started getting pegged as shown with the jtop utility:
https://i.imgur.com/DvcQnSa.png
After 30 minutes, the cars/buses in the videos shown on the output are “slowing down”.
The performance output on the terminal has been greatly reduced:
**PERF: 4.13 (7.80) 4.59 (7.77) 4.41 (7.76) 4.43 (7.71) 4.19 (7.72)4.53 (7.72) 4.13 (7.80) 4.25 (7.73)
**PERF: 4.44 (7.79) 4.36 (7.76) 4.06 (7.75) 4.50 (7.70) 4.56 (7.71)4.26 (7.71) 4.36 (7.79) 4.45 (7.72)
The top utility confirms that it is deepstream that is using all of the CPU:
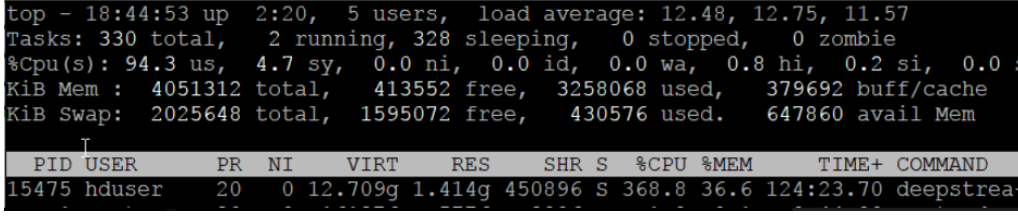
Here are the details shown by the jtop utility:
https://i.imgur.com/7bbWmev.png
Previous experimentation prompted us to enable the drop-frame-interval & set it to 2 or 3 (depending on the bandwidth of the attached IP camera).
-With this setting disabled, high latency was seen between actual movement & output seen on screen. By changing it to 2 or 3 (for a 30fps camera), improved this latency & didn’t seem to affect the Object detection/tracking.
-This variable seemed a way to “normalize” the inputs if different camera bandwidths are used.
-Our understanding from the documentation is that this setting determines which frames that the hardware decoder outputs e.g. 3 would mean that the decoder outputs every 3rd frame.
-If that understanding is correct, we would expect that the CPU usage would actually decrease as this value increases. Or is that an incorrect assumption?
We appreciate any help that you can offer with this.
I have attached the configuration file below.
Thanks,
Vince
# Copyright (c) 2019 NVIDIA Corporation.  All rights reserved.
#
# NVIDIA Corporation and its licensors retain all intellectual property
# and proprietary rights in and to this software, related documentation
# and any modifications thereto.  Any use, reproduction, disclosure or
# distribution of this software and related documentation without an express
# license agreement from NVIDIA Corporation is strictly prohibited.

[application]
enable-perf-measurement=1
perf-measurement-interval-sec=5
#gie-kitti-output-dir=streamscl

[tiled-display]
enable=1
rows=2
columns=4
##Orig was width-1280 & height=720
width=1280
height=720
gpu-id=0
#(0): nvbuf-mem-default - Default memory allocated, specific to particular platform
#(1): nvbuf-mem-cuda-pinned - Allocate Pinned/Host cuda memory, applicable for Tesla
#(2): nvbuf-mem-cuda-device - Allocate Device cuda memory, applicable for Tesla
#(3): nvbuf-mem-cuda-unified - Allocate Unified cuda memory, applicable for Tesla
#(4): nvbuf-mem-surface-array - Allocate Surface Array memory, applicable for Jetson
nvbuf-memory-type=0

[source0]
enable=1
#Type - 1=CameraV4L2 2=URI 3=MultiURI 4=RTSP
type=3
uri=file://../../streams/sample_1080p_h264.mp4
num-sources=8
##Orig was commented out, 3 causes High CPU usage,1 worked with demo mp4
drop-frame-interval=3
gpu-id=0
# (0): memtype_device   - Memory type Device
# (1): memtype_pinned   - Memory type Host Pinned
# (2): memtype_unified  - Memory type Unified
cudadec-memtype=0

[sink0]
enable=1
#Type - 1=FakeSink 2=EglSink 3=File
type=5
##Orig was 1 but we have seen stuttering with it
sync=0
source-id=0
gpu-id=0
qos=0
nvbuf-memory-type=0
overlay-id=1

[sink1]
enable=0
type=3
#1=mp4 2=mkv
container=1
#1=h264 2=h265
codec=1
sync=0
#iframeinterval=10
bitrate=2000000
output-file=out.mp4
source-id=0

[sink2]
enable=0
#Type - 1=FakeSink 2=EglSink 3=File 4=RTSPStreaming
type=4
#1=h264 2=h265
codec=1
sync=0
bitrate=4000000
# set below properties in case of RTSPStreaming
rtsp-port=8554
udp-port=5400

[osd]
enable=1
gpu-id=0
border-width=1
text-size=15
text-color=1;1;1;1;
text-bg-color=0.3;0.3;0.3;1
font=Serif
show-clock=0
clock-x-offset=800
clock-y-offset=820
clock-text-size=12
clock-color=1;0;0;0
nvbuf-memory-type=0

[streammux]
gpu-id=0
##Boolean property to inform muxer that sources are live
live-source=0
batch-size=8
##time out in usec, to wait after the first buffer is available
##to push the batch even if the complete batch is not formed
batched-push-timeout=40000
## Set muxer output width and height
width=1920
height=1080
##Enable to maintain aspect ratio wrt source, and allow black borders, works
##along with width, height properties
enable-padding=0
nvbuf-memory-type=0

# config-file property is mandatory for any gie section.
# Other properties are optional and if set will override the properties set in
# the infer config file.
[primary-gie]
enable=1
gpu-id=0
model-engine-file=../../models/Primary_Detector_Nano/resnet10.caffemodel_b8_fp16.engine
batch-size=8
#Required by the app for OSD, not a plugin property
bbox-border-color0=1;0;0;1
bbox-border-color1=0;1;1;1
bbox-border-color2=0;0;1;1
bbox-border-color3=0;1;0;1
interval=4
gie-unique-id=1
nvbuf-memory-type=0
config-file=config_infer_primary_nano.txt

[tracker]
enable=1
tracker-width=480
tracker-height=272
#ll-lib-file=/opt/nvidia/deepstream/deepstream-4.0/lib/libnvds_mot_iou.so
ll-lib-file=/opt/nvidia/deepstream/deepstream-4.0/lib/libnvds_mot_klt.so
#ll-config-file required for IOU only
#ll-config-file=iou_config.txt
gpu-id=0

[tests]
##Orig was 0
file-loop=1