Hi,
is there something similar to “top” to monitor the graphic adapter and the gpu ?
Thanks in advance.
Bernd
Hi,
is there something similar to “top” to monitor the graphic adapter and the gpu ?
Thanks in advance.
Bernd
nvidia-smi -i 3 -l -q -d will give you output include a “busy” and “memory used” percentage as well as ECC stats on Fermi Teslas, and other stuff like temps and fanspeeds at 3 second intervals, something like top does:
==============NVSMI LOG==============

Timestamp			: Wed Jan 26 19:51:54 2011

Driver Version			: 260.19.21

GPU 0:

	Product Name		: GeForce GTX 275

	PCI Device/Vendor ID	: 5e610de

	PCI Location ID		: 0:1:0

	Board Serial		: 154552075019

	Display			: Connected

	Temperature		: 56 C

	Fan Speed		: 40%

	Utilization

	    GPU			: 1%

	    Memory		: 3%

GPU 1:

	Product Name		: GeForce GTX 470

	PCI Device/Vendor ID	: 6cd10de

	PCI Location ID		: 0:4:0

	Board Serial		: 6178347089

	Display			: Not connected

	Temperature		: 83 C

	Fan Speed		: 55%

	Utilization

	    GPU			: 0%

	    Memory		: 0%

	Volatile ECC errors	:

	  Single bit		:

	    FB			: 0

	    RF			: 0

	    L1			: 0

	    L2			: 0

	    Total		: 0

	  Double bit		:

	    FB			: 0

	    RF			: 0

	    L1			: 0

	    L2			: 0

	    Total		: 0
GPU busy is actually the percentage of time over the last second the SMs were busy, and the memory utilization is actually the percentage of bandwidth used during the last second. Full memory consumption statistics come with the next release.
Hi,
my output is much less verbose:
pc56846:~ # nvidia-smi -a -q
GPU 0:
    Product Name            : GeForce GTX 460

    PCI ID                  : e2210de

    Temperature             : 40 C
Why do you have much more informations ?
Bernd
You need the -d option, I think, otherwise I am not sure.
pc56846:~ # nvidia-smi -d -q
GPU 0:
    Product Name            : GeForce GTX 460

    PCI ID                  : e2210de

    Temperature             : 39 C
Unfortunaly the same.
Bernd
What driver and CUDA version are you using. I think this only works with CUDA 3.2.
CUDA 3.1 and driver 256.40 (or 256.53), currently i don’t know exactly.
Bernd
Hi,
you are right. CUDA Toolkit 3.2 Downloads | NVIDIA Developer says
“New NVIDIA System Management Interface (nvidia-smi) support for reporting % GPU busy, and several GPU performance counters”
Bernd
I second that request.
Let us say multiple GPU APPs are running, the “TOP” utility shows only the CPU usage of the processes.
Even when a GPU App is sleeping, the kernels spawned by it could be actively running on the GPU.
So, what “Top” shows is completely irrelevant for us.
It would be very good to see what actual kernel is running on the GPU. Only the driver can tell that.
If NVIDIA can tell us info on
Thanks
Best Regards,
Sarnath
Here is something I wrote to sort of address the need for a top like tool for NVIDIA GPUs:
For Linux, I use this HTOP like tool that I wrote myself. It monitors and gives an overview of the GPU temperature as well as the core / VRAM / PCI-E & memory bus usage. It does not monitor what’s running on the GPU though. [url]https://github.com/mountassir/gmonitor[/url]
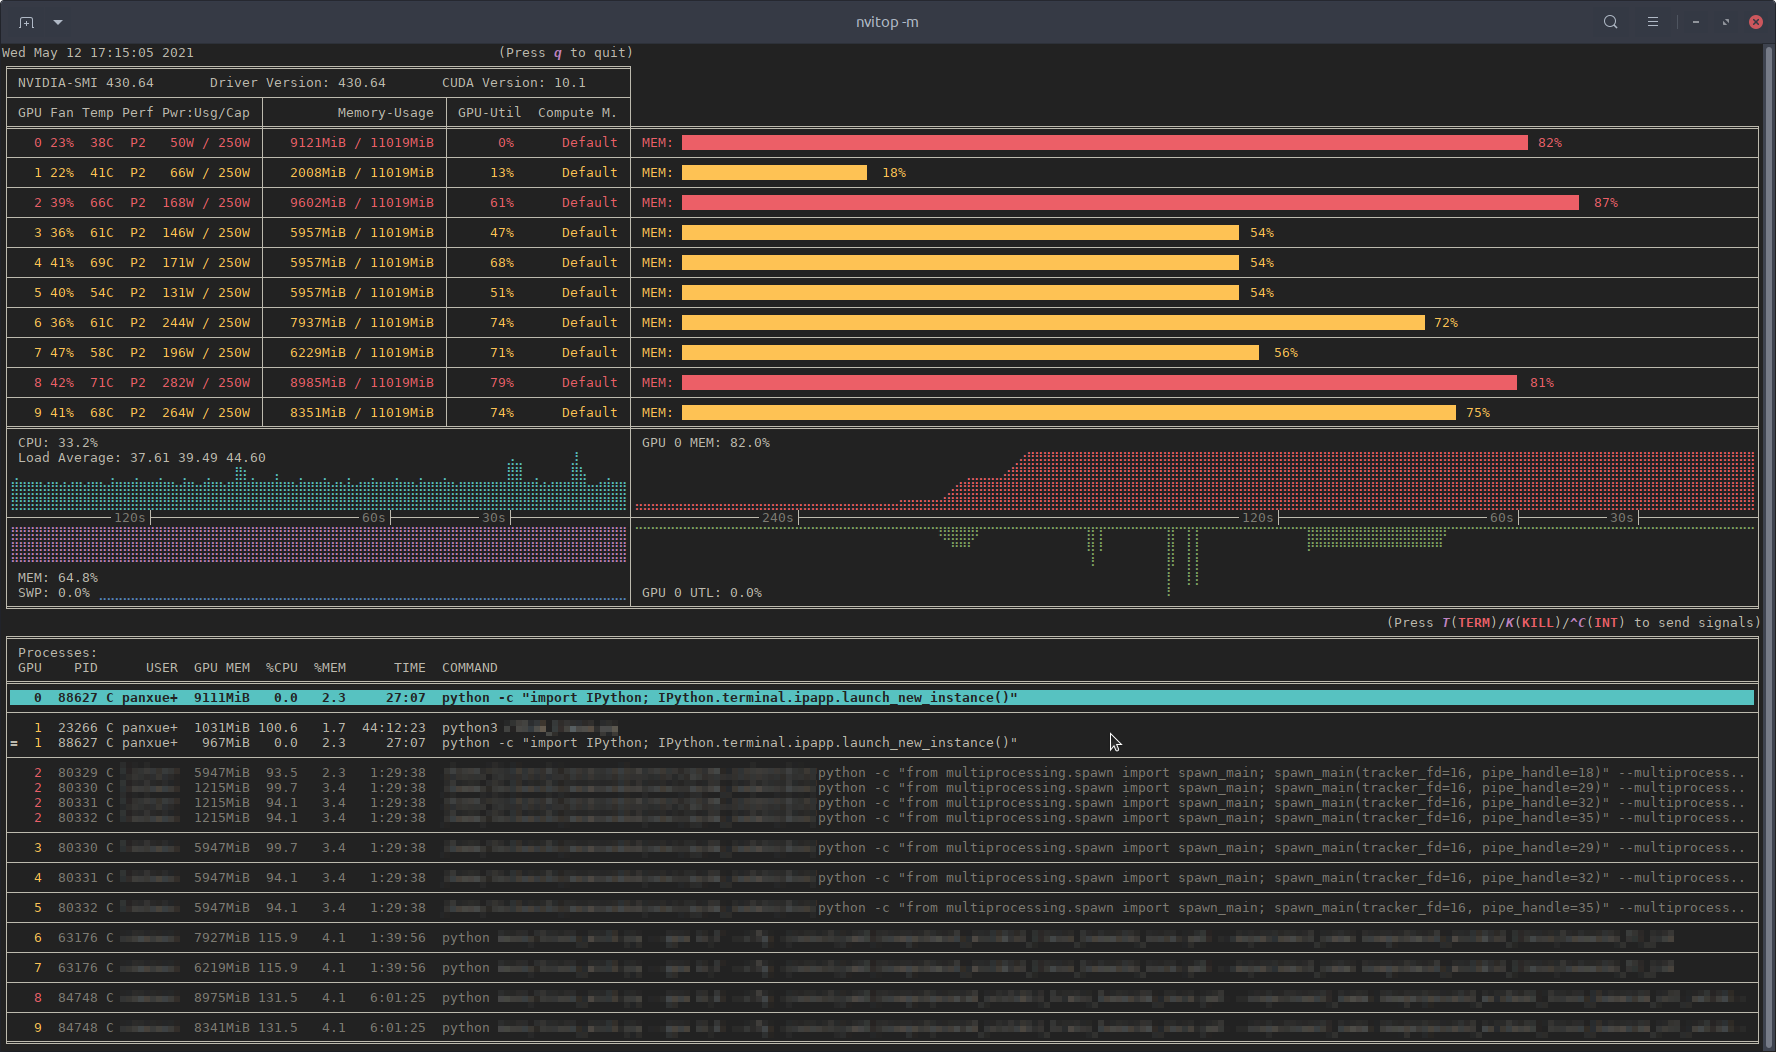
Try out nvitop, a monitor based on NVML Python bindings nvidia-ml-py:
On Linux:
On Windows:
Tree-view: