Jofo
April 2, 2015, 11:38am
1
Hello,
Before: http://fs2.directupload.net/images/150402/u6nb54po.png
After: http://fs2.directupload.net/images/150402/a5oyrh98.png
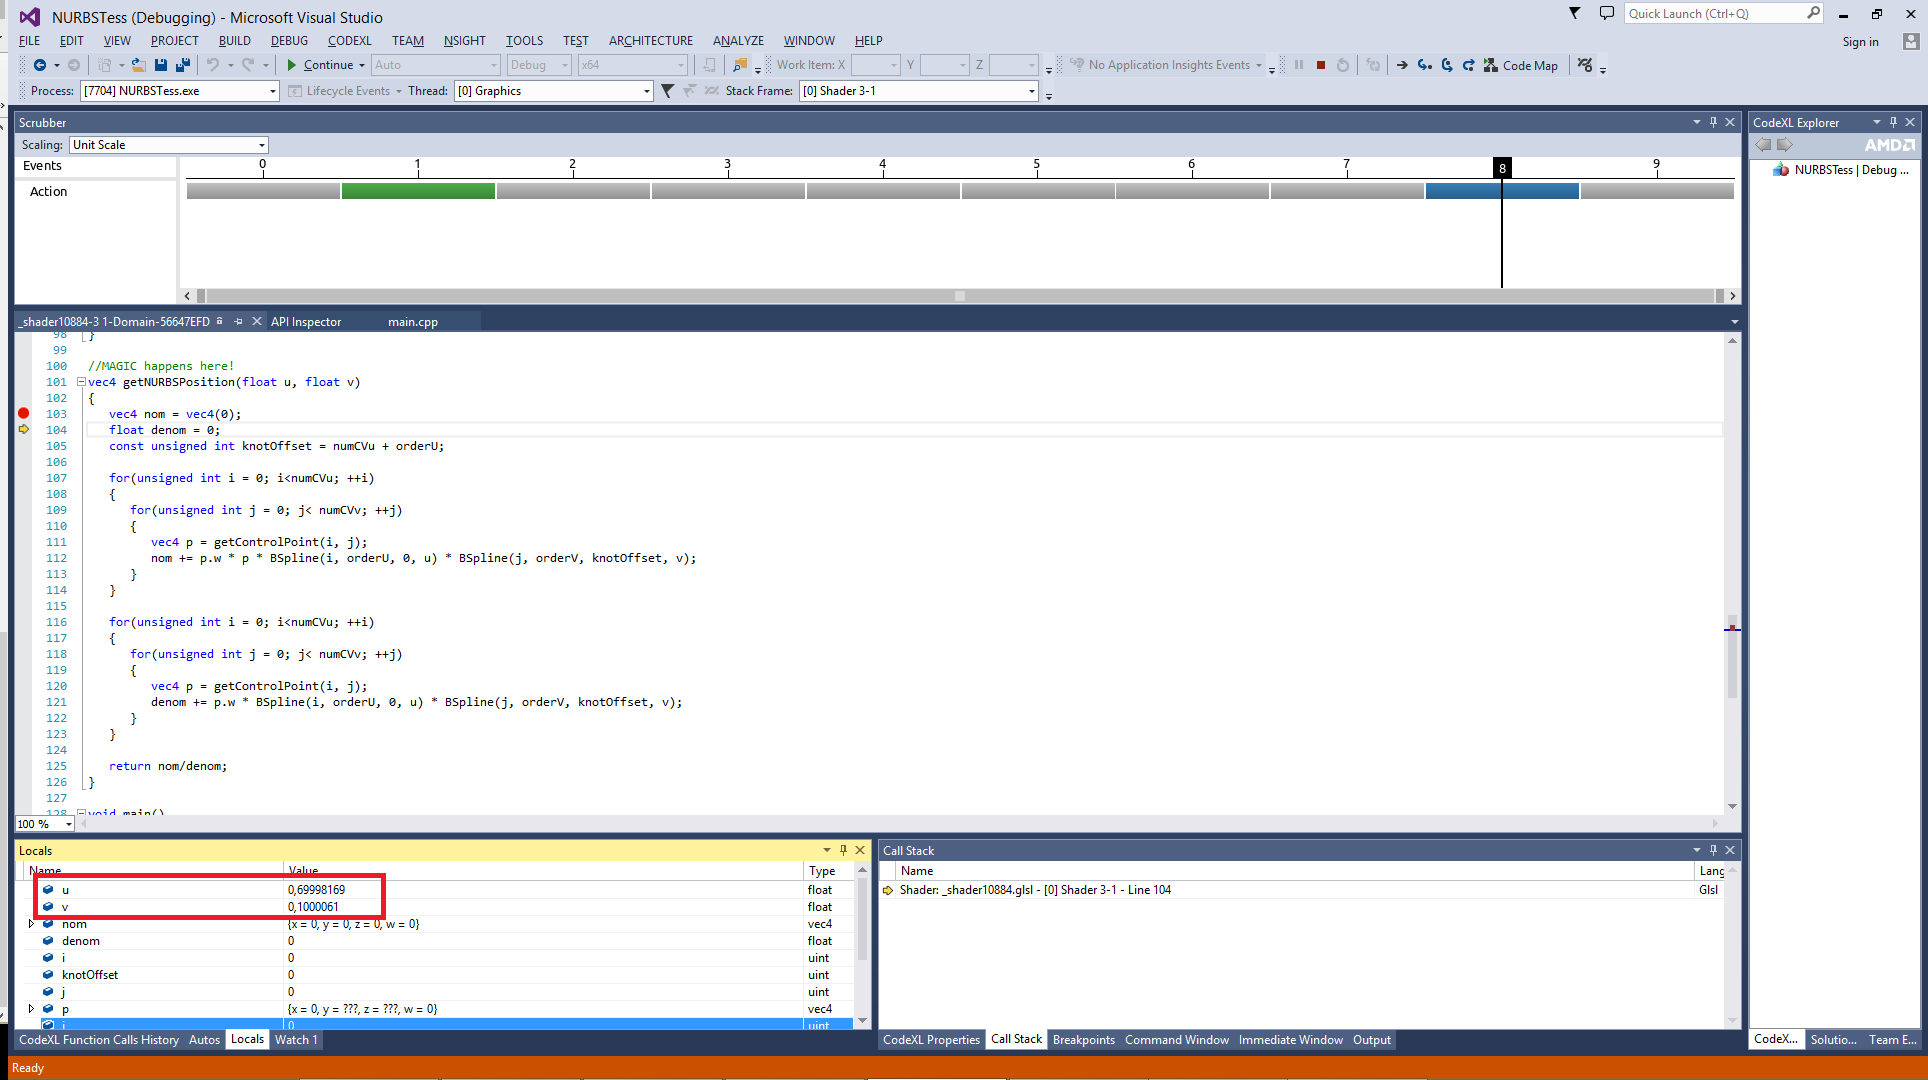
I’m stepping through a function, which receives U and V tesscoords, and U coordinate just changed for no reason after few steps.
My setup:
Thank You!
AYan
April 7, 2015, 9:19am
2
Hi Jofo,
Your screen shot just blocked, I can’t watch it. Could you upload it to some other place? like http://imgur.com/
I don’t know your situation yet, but I’m guessing something might be related:
maybe you are still step in the current instance run of your tessellation shader, some variable may change in next instance run
some optimize may happen
maybe you can try remote debug [two machine], but not local debug [one machine]
For effective response, could you share us some sample about your issue? That can make support and fix much easier.
Thanks
Jofo
April 7, 2015, 5:05pm
3
Screenshots work for me on two different machines, but reuploaded
Before: http://i.imgur.com/UjSobiC.png
After: http://i.imgur.com/0jiTqwA.png
I didn’t re-run the shader, I just hit F10 and it looks like it just transits into other instance while stepping through it. I will supply the shader code when I go to work.
AYan
April 8, 2015, 5:33am
4
Hi Jofo,
I need some confirm about your issue:
you are doing local shader debug, right? I mean you just have one machine, and launch you sample, pause&capture, then set bp in it, am I correct?
I’m guessing your u, v variables are just equal to gl_TessCoord value, right?
Thanks
Jofo
April 8, 2015, 9:21am
5
Yes, I’m debugging locally, single GPU in the system, frame capture, breakpoint in shader. I call that function in main() like:
vec4 pos = getNURBSPosition(gl_TessCoord.x, gl_TessCoord.y);
Jofo
April 8, 2015, 9:24am
6
Full shader code here:
#version 430

layout(quads, equal_spacing, ccw) in;

in vec4 cp[];
out vec4 position;

//Uniforms
uniform mat4 mvp;

uniform NURBS_desc
{
   unsigned int numCVu;
   unsigned int numCVv;
   unsigned int orderU;
   unsigned int orderV;
};

layout(std430, binding = 0) buffer knotVector
{
   float knots[];
};

#define CURVE_DEGREE 2
#define N_SIZE 1<<(CURVE_DEGREE-1)

//Mapping table for getting x in "i+x"
unsigned int getI[8] = {0, 1, 1, 2, 1, 2, 2, 3};

float evalFrac(float x, float y)
{
   return y==0 ? 0 : x/y;
}

//Evaluates B-Spline value for degree 1 curve
float BSplineDeg1(unsigned int i, unsigned int knotOffset, float t)
{
   if((knots[knotOffset+i] <= t) && (t < knots[knotOffset+i+1]))
         return 1.0f;
      else
         return 0.0f;
}

float BSpline(unsigned int i, unsigned int degree, unsigned int knotOffset, float t)
{
   //--
   if(degree==1)
      return BSplineDeg1(i, knotOffset, t);

   //Evaluate for degree=1 first (init leaves)
   //const unsigned int num = 1 << (k-1);
   float n[N_SIZE];
   for(unsigned int a = 0; a<N_SIZE; ++a)
   {
      n[a] = BSplineDeg1(i+getI[a], knotOffset, t);
   }

   //Going bottom-up in tree
   unsigned int level = degree-1;
   unsigned int d = 2; //degree 1 is already in n[]
   unsigned int num = 1 << (level-1);

   while(level >=1)
   {
      for(unsigned int a = 0; a<num; ++a)
      {
         n[a] = evalFrac((t - knots[knotOffset+getI[a]]), (knots[knotOffset+getI[a]+d-1] - knots[knotOffset+getI[a]])) * n[2*a] + evalFrac((knots[knotOffset+getI[a]+d] - t), (knots[knotOffset+getI[a]+d] - knots[knotOffset+getI[a]+1])) * n[2*a + 1];
      }

      ++d;
      --level;
      num = num >> 1;
   }

   //Result in n[0]
   return n[0];
}

vec4 getControlPoint(unsigned int i, unsigned int j)
{
   return cp[i*numCVu + j];
}

//MAGIC happens here!
vec4 getNURBSPosition(float u, float v)
{
   vec4 nom = vec4(0);
   float denom = 0;
   const unsigned int knotOffset = numCVu + orderU;

   for(unsigned int i = 0; i<numCVu; ++i)
   {
      for(unsigned int j = 0; j< numCVv; ++j)
      {
         vec4 p = getControlPoint(i, j);
         float s1 = BSpline(i, orderU, 0, u);
         float s2 = BSpline(j, orderV, knotOffset, v);
         nom += p.w * p * s1 * s2;
      }
   }

   for(unsigned int i = 0; i<numCVu; ++i)
   {
      for(unsigned int j = 0; j< numCVv; ++j)
      {
         vec4 p = getControlPoint(i, j);
         denom += p.w * BSpline(i, orderU, 0, u) * BSpline(j, orderV, knotOffset, v);
      }
   }

   return nom/denom;
}

void main()
{
   vec4 pos = getNURBSPosition(gl_TessCoord.x, gl_TessCoord.y);

   //Transform
   position = mvp * pos;
}
AYan
April 13, 2015, 3:46am
7
Hi Jofo,
I just double confirmed your issue by writing some sample codes, it looks like a bug in Shader Debug that make the input varying changing during stepping.
We are fixing it.
There is also some WAR, you can use two machine to do remote shader debug, and you will find the magic just goes away.
Thanks